
X The Coming Economic Mega Crisis
It is highly likely that the coming Oil Crisis will only get worse. This will lead not only to rising gas prices, but also rising energy prices, and rising food costs. These rising prices will mean that Americans will have less money to spend on everything else – which will cause a huge number of businesses to fold and a huge number of people to lose their jobs.
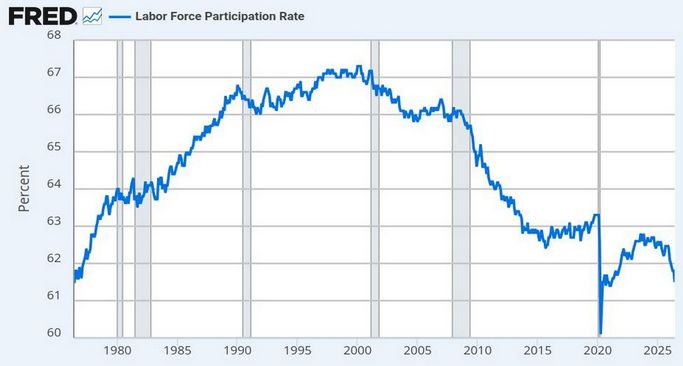
According to the US Bureau of Labor Statistics monthly report issued on July 2, 2026, covering from May 1 to June 1 2026, Americans participating in the workforce fell to 61.5% - its lowest level outside the COVID-19 pandemic in 50 years since June 1976:
Here is the Labor Force Participation Rate for all of 2026:
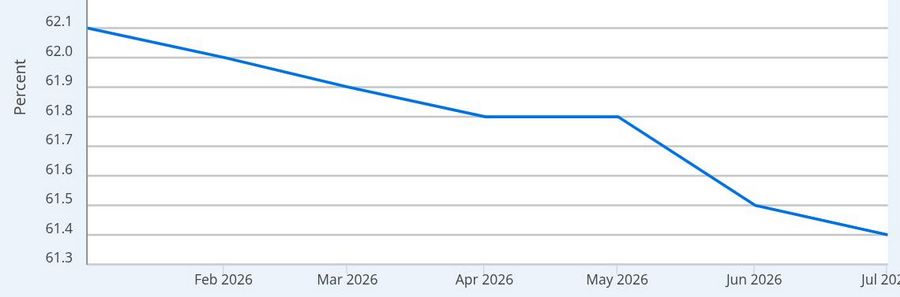
The above chart shows that the US economy was extremely week even before the Iran War. But people really started losing their jobs in May 2026. On page 4 of the BLS monthly report, the workforce population grew by 112,000 but the number of people who left the workforce due to the loss of their job grew by 720,000 for a combined increase in “Not in the Labor Force” of 832,000. Combine this with an increase of 200,000 in the number of people who could only find part time work and the net result is an increase of about one million American workers in May 2026 whose job situation got much worse.
For the first time in US history, 106 million people were “Not in the Labor Force.”
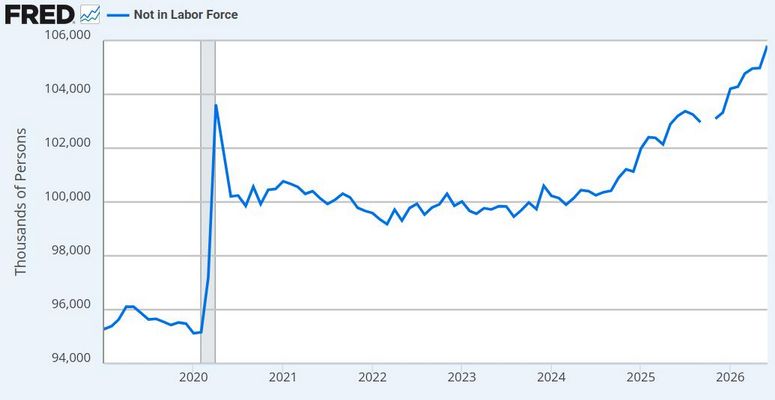
The next BLS job report is due in August. It is likely that it will show another steep increase in the “Not in the Labor Force” number – with even bigger increases to follow in September and October 2026. The reason these people are “Not in the Labor Force” is because their 26 weeks of Unemployment Insurance have run out. They therefore have fallen into the ranks of the “Invisible Unemployed.”
The Iran War Interest Rate Trap
Normally, the Fed tries to reduce the effect of job losses by lowering their interest rate. However, when there is rampant inflation, the Fed raises interest rates. The Iran War has created an Interest Rate trap that forces the Fed to raise interest rates despite the economy crashing. Two Year US bonds are a leading indicator of future interest rates. Here is an image showing the Inflation to Interest Rate Trap began in April 2026:
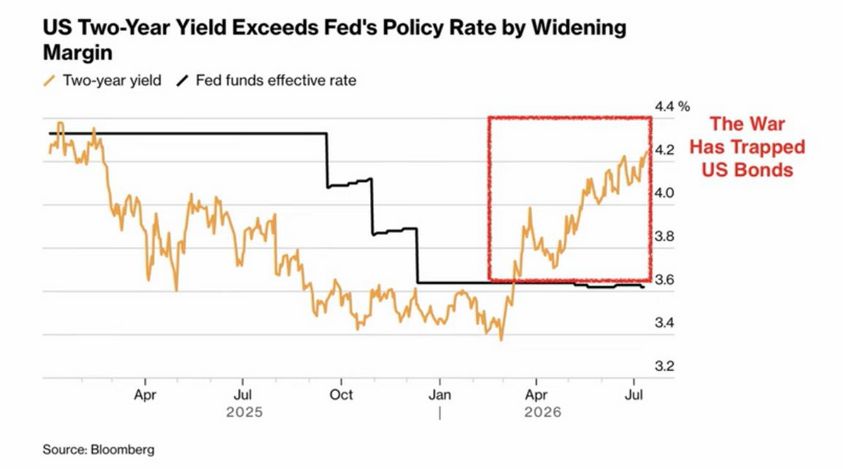
The reality of the two year bond auctions will likely force the Fed to raise the Fed Funds rate in August 2026 – which will only cause more business failures and more job losses.
The Coming Consumer Debt Crisis
More than 100 million Americans are already facing a massive credit card debt problem. The underlying cause of this debt problem was not only the loss of living wage jobs, but the near doubling of credit card interest rates in the past 10 years from 12 percent in 2016 to 22% today.
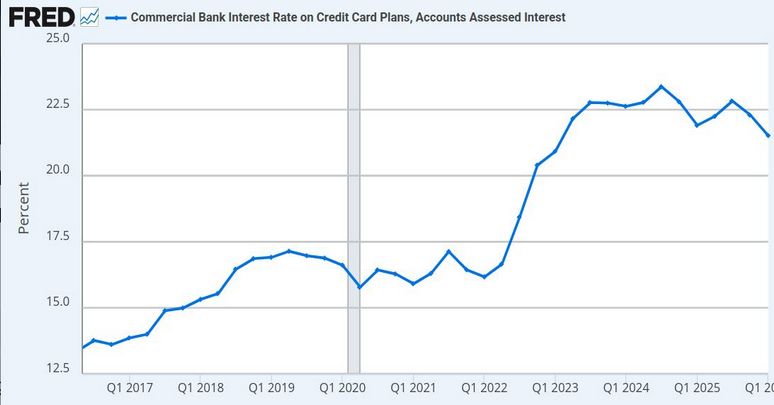
During the 2024 Election, Trump not only promised to end forever wars, he also promised to reduce credit card interest back to its historic average of 10%. This was a major reason many low income people voted for him.
About 227 million Americans — over four in five U.S. adults —collectively owe approximately $1.27 trillion in credit card debt.
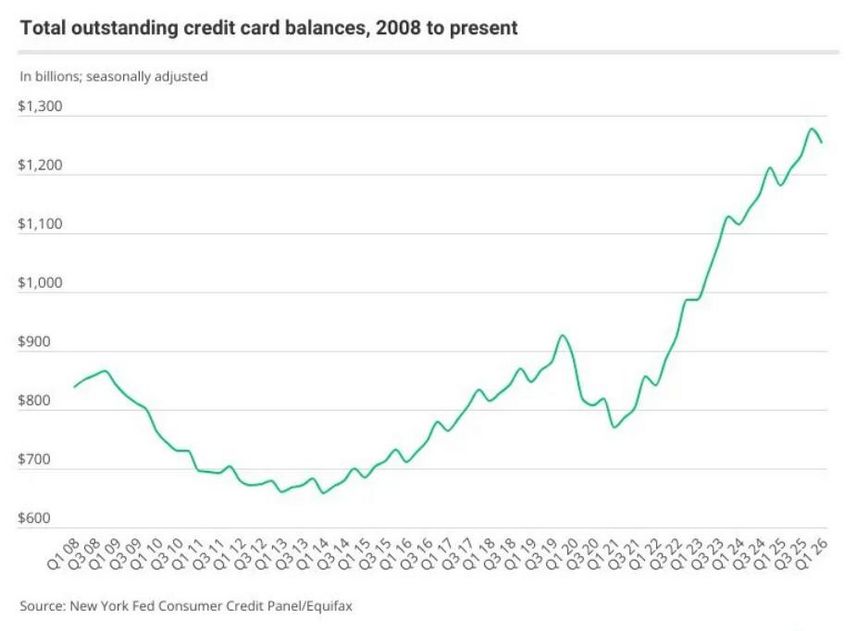
This is the largest amount of credit card debt ever owed by American families. Americans have paid $2 trillion in credit card interest since 2010. These cardholders are exposed to record-high interest rates that further raise their credit costs. 111 million Americans - over 40 percent of all US adults— are unable to pay off their credit card bills each month, trapping them in cycles of persistent debt that balloons ever-higher due to record-high, industry-inflated interest rates and predatory bank late fees
From 2007 to 2026, banks doubled their profit margins by doubling their credit card charges. As a result, Americans now pay the most money ever recorded in credit card interest charges and fees. From 2018 to 2026, the average monthly credit card payment rose by $560, or 38 percent, from $1,441 to nearly $2,000 per month. Credit card balances have risen by $482 billion since Q1 2021 - a 63% increase over five years. One in four Americans has at least $10,000 of credit card debt. Roughly 13% of credit card balances are at least 90 days past due, marking the highest delinquency rate seen in 15 years. Annually, these low income Americans pay more than $200 billion in credit card interest payments.
The national average card debt among cardholders with unpaid balances in 2025 was $7,886, up 2.8% from $7,673 in 2024.
Washington state has the fastest-growing card debt. That state’s average card balance grew 12% from 2024 to 2025, rising from $8,086 to $9,039. For all credit cards, the average Interest Rate in Q2 2026 was 22% per year. Thus, if a person has a credit card debt of $8000, they must pay $1,760 in interest payments per year or $147 per month just to keep their principal balance from rising.
This debt accumulated not because of too many spending sprees at the local shopping mall. Instead, the number one cause of inflated credit card debt was to pay for medical bills that were not covered by health insurance. According to a 2022 poll from the Kaiser Foundation, almost half of Americans have a major medical debt.
The rapid increase in the price of food in 2027 will only make the financial problems of the working poor even worse. With food and gas prices rising, Americans have already accumulated more than a trillion dollars in “survival debt”—liabilities accrued to pay for everyday expenses. As more people struggle to make ends meet and consumer debt reaches record highs, at some point, the whole financial debt bubble in the United States is likely to explode into the worse Mega Depression of all time.
Calculating how bad it will get using the relationship between energy consumption and real GDP
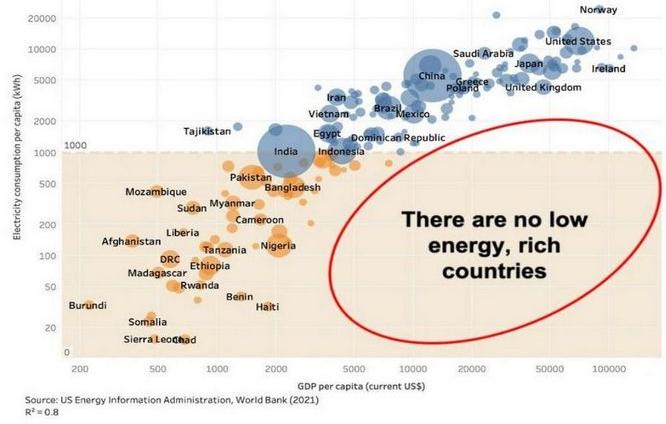
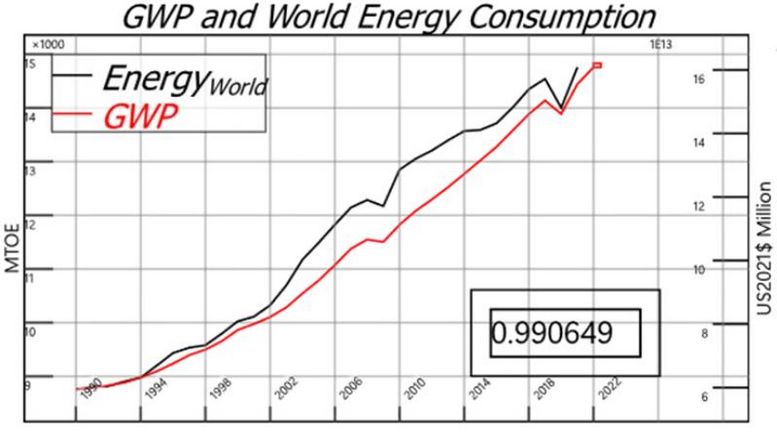
It has long been known that there is a direct relationship between energy consumption and real GDP.
Here is a graph of world energy consumption to GPD for the past 30 years:
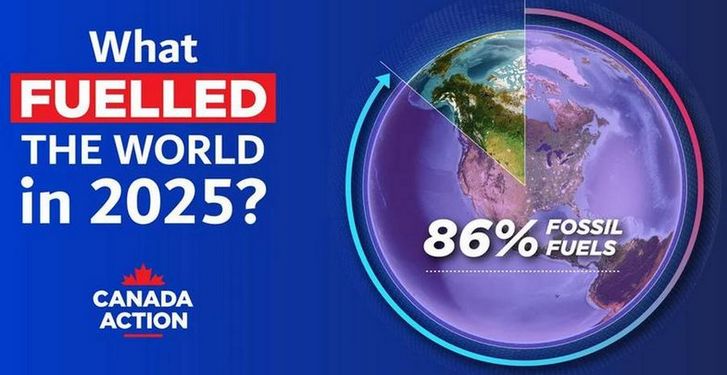
It is also known that 86% of global energy comes from fossil fuels.
It has been claimed that energy consumption is “price-inelastic.” This means that when energy prices rise, the total amount consumed changes very little because people and businesses rely on power, heating, and fuel for daily living and cannot instantly change their habits. However, this claim likely does not apply to major changes in energy prices where American families on limited budgets are forced to choose between food for their kids or gas for their cars.
Here is a chart of the relationship of disposable personal income and GDP growth:
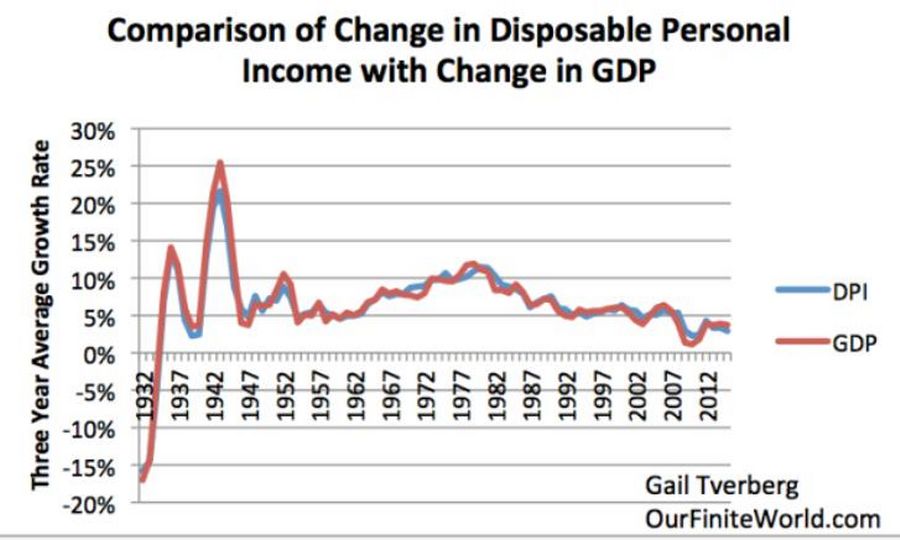
Therefore if disposable personal income declines, many businesses will go out of business and many people will lose their jobs – creating a downward economic spiral.
How much did disposable income and GDP decline during the early years of the Great Depression?
The fundamental cause of the Great Depression in the United States was a decline in spending (sometimes referred to as aggregate demand), which led to a decline in production and a decline in jobs combined with a collapse of the banking system which wiped out the savings of millions of families. The decline in disposable income was about 20% and according to the Federal Reserve, the decline in GDP was about 29%.
Putting all of this together, it is likely that a 100% increase in the price of energy will lead to a Mega Depression much worse and much longer than the Great Depression.